Hadal
Every animal at the depth it actually lives.
What it is
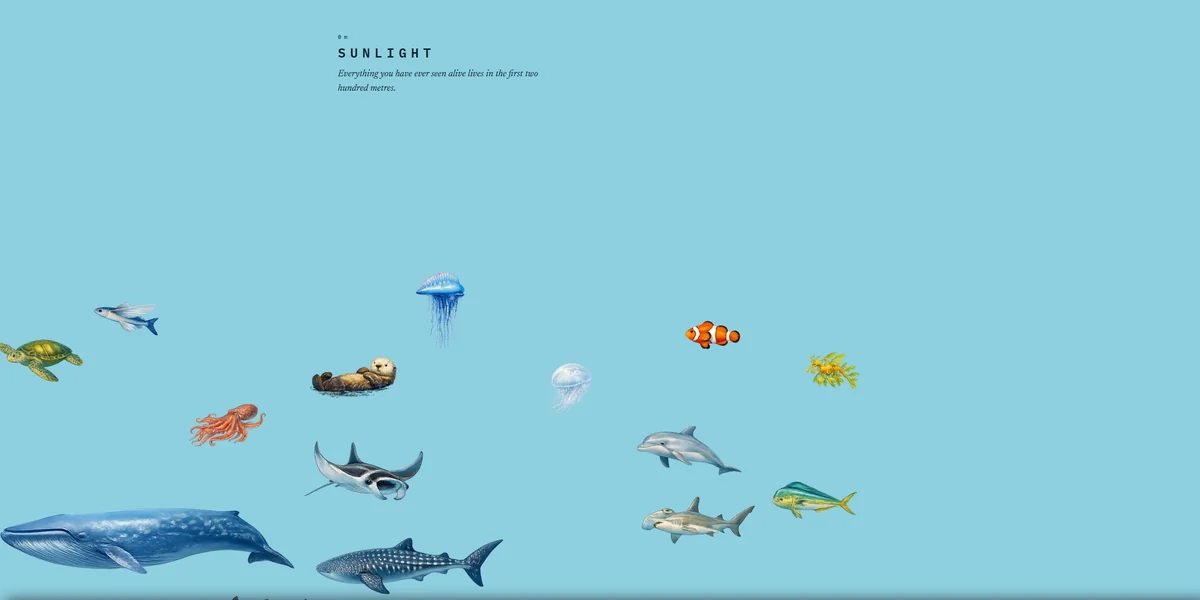
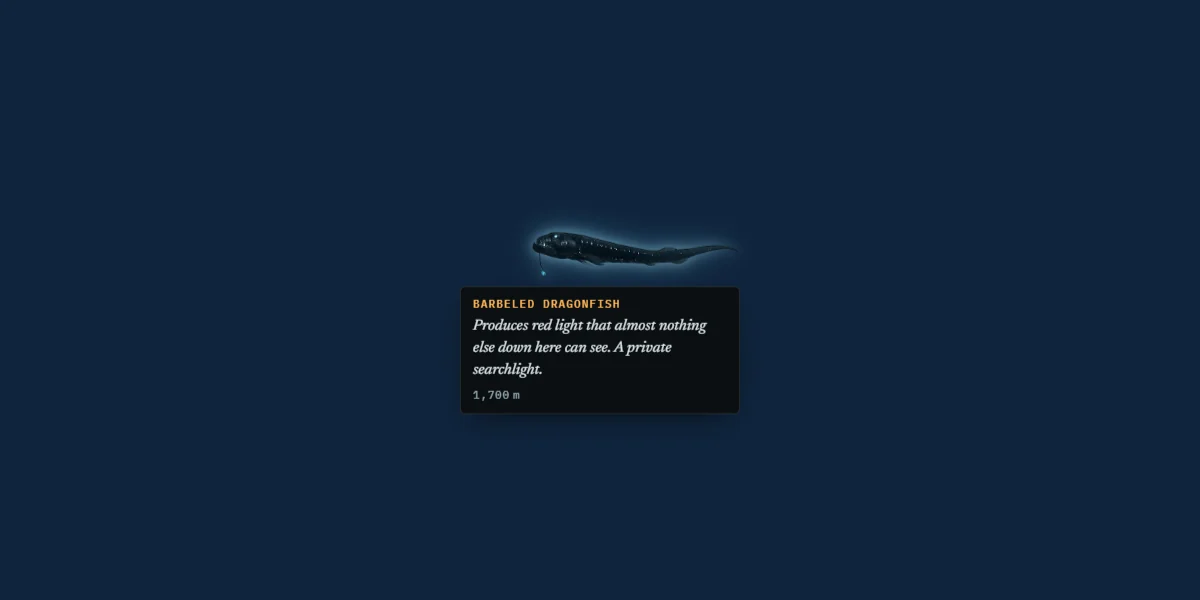
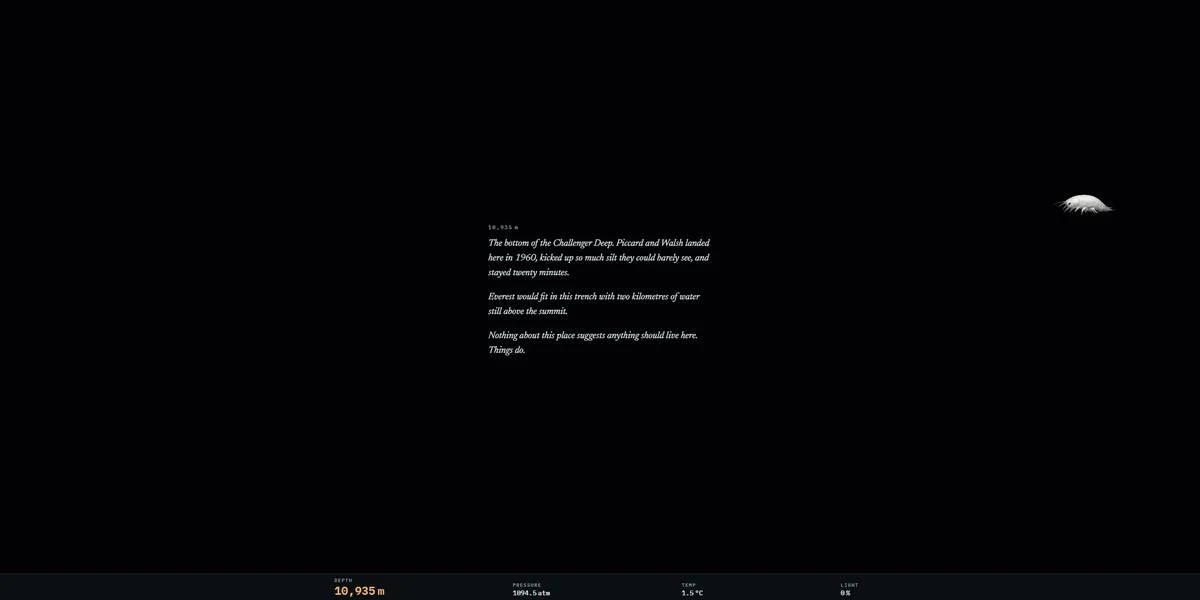
Hadal is a single-page site that maps your scroll position to ocean depth. You start at the surface and scroll towards the Challenger Deep, with the page ending at 10,935 metres. As you descend, 43 animals appear at depths where they can be found. Each is shown at one point within its habitat or diving range. The instrument panel shows your depth alongside estimates of pressure, temperature, and remaining light.
I built it with plain HTML, CSS, and vanilla JavaScript. There are no frameworks and no build steps.
The problem
Looking at a standard ocean diagram doesn't really give you a feel for the distance. I wanted the descent to take time, with a consistent relationship between scrolling and depth. The panel uses simplified formulas to suggest how conditions change, rather than measurements from a particular dive.
The main challenge was mapping that scale onto one web page without breaking the layout, the performance, or the readability.
The decisions
Mapping scroll to depth
The page is about 54,000 pixels tall, which is five pixels for every metre of ocean. I wrote a small formula to turn the scroll position into metres. At first I placed each animal at its depth multiplied by five pixels, and they showed up slightly too early on the screen.
The reason is that the scrollable distance is the page height minus one screen height. I now use that same distance for both the panel and the animal positions, then add half a screen to centre the animals. Their base positions line up with the panel's depth reading, apart from the small drift animation.
Scaling the animals
A blue whale is 25 metres long. An amphipod at the bottom of the trench is 4.5 centimetres. That is a difference of 556 to 1. My first attempt was size buckets, small and medium and large, which looked terrible and threw away the real data.
Next I sized them straight from their real length. That was wrong too. An ocean sunfish is 2.5 metres and shaped like a disc, a great white is 4.5 metres and long and thin, and sized by length the two covered almost the same screen area even though the shark is nearly twice as long. The sunfish looked bigger, because a disc always does.
So I sized by image area instead. Each animal gets a target area from its length, and its image proportions decide whether the box comes out wide and flat or tall and round. The shark gets a larger box than the sunfish without a separate rule for either animal.
The animals are not shown at their true relative sizes. That would make the amphipod too small to see. A curve brings the sizes closer together, and the limits change with screen width. Images are also kept within their original dimensions. It is a compromise, but the point of the piece is that something lives down at the bottom, and it has to be visible.
Fixing the contrast
The background changes continuously from bright cyan to near-black, so any fixed text colour becomes unreadable somewhere in the descent. I tried fading the text colour along with the background, but there is always a crossing point where the text and the water are the same brightness.
Instead of fighting the background, I stopped putting text on it. The panel and the creature captions sit on a solid dark surface, which holds 10.9:1 for the amber text and 16:1 for the body text at every depth. The zone titles are the exception, because they float in the water. I darkened the 200 metre colour stop until amber cleared 5.6:1 there. The surface marker is the one place neither approach works: amber on bright cyan measures 1.02:1, so it uses dark ink instead.
Those titles have nothing behind them, so the layout places the animals in depth order and treats the text as something to avoid. When an animal is too wide and there is nowhere left for it, the label moves instead. A label can sit to the side of the depth it names. An animal cannot sit at the wrong depth.
Performance and accessibility
To avoid loading and animating all 43 animals at once, images load as they approach the screen and drift pauses once an animal is well outside it. The layout starts from a fixed random seed, so it repeats at the same screen size instead of reshuffling on every visit.
Every animal can also be focused with the Tab key to read its facts, and the animations stop completely if the user has reduced motion enabled.
What I would do differently
The biggest lesson was to store the real data, not the rendering decision. My first attempt put size buckets like large or small in the data file, so every time I changed the formula I had to rethink them. Storing the actual length in metres meant the data survived every rewrite of the UI.
I would also label the panel's estimates more clearly in the app. Pressure uses a simple depth formula, while temperature and light follow fixed curves. They help tell the story of the descent, but should not look like precise readings from the ocean.